
In CNC machining, surface finish describes the microscopic texture left on a part after cutting, grinding, or polishing.
It directly affects how a component performs—its friction, wear resistance, sealing ability, fatigue strength, and even its visual appearance.
Every tool path and cutting motion leaves fine marks, forming peaks and valleys measured in micrometers.
A smoother surface with smaller irregularities usually results in better assembly fits, higher corrosion resistance, and improved durability.
Typical values range from Ra 3.2 µm for general machining to Ra 0.8 µm or finer for sealing or precision surfaces.
What Is Surface Finish
Surface finish, sometimes called surface texture, refers to the small-scale irregularities on a material’s surface.
It includes three main elements—roughness, waviness, and lay—which together define the overall topography.
- Roughness: Fine irregularities created by the cutting process.
- Waviness: Larger undulations caused by vibration or deflection.
- Lay: The dominant pattern direction produced by the machining path.
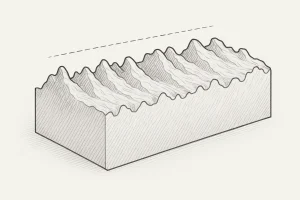
Three-dimensional technical sketch of a machined surface profile, illustrating peaks, valleys, and mean line for roughness evaluation.
These combined factors determine both the functional and aesthetic quality of a machined part.
Why Surface Finish Matters in Machining
Surface finish influences almost every performance aspect of a component.
- Fit and dimensional accuracy – Smooth surfaces ensure proper mating and tight tolerance control.
- Friction and wear – Reduced roughness minimizes friction and extends part life.
- Fatigue resistance – Smooth profiles eliminate stress concentration points that can lead to cracks.
- Lubrication and sealing – Proper surface texture improves fluid retention and sealing reliability.
- Coating adhesion – Even textures promote uniform coating and plating.
For high-precision sectors such as aerospace, medical, and mold manufacturing, surface finish directly links to reliability, cost efficiency, and product lifespan.
How Surface Finish Is Measured
Surface finish measurement quantifies the height variations on a surface to generate numerical roughness values.
Three main measurement methods are commonly used:
- Contact profilometer – A stylus traverses the surface and records vertical deviations to compute Ra, Rz, and RMS.
- Optical measurement – Non-contact systems such as laser or white-light interferometers capture surface profiles quickly and without damage.
- Comparison method – Operators compare the workpiece with standard reference plates or specimens for rapid inspection on the production floor.
Modern workshops typically use contact profilometers because they balance accuracy, cost, and calibration simplicity.
Surface Finish Parameters and Symbols
Surface finish is defined by several key parameters and standardized notations used in technical drawings.
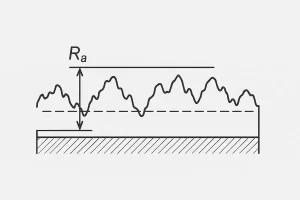
Technical diagram illustrating how Ra (arithmetic average roughness) is measured on a machined surface profile.
Ra – Arithmetic Mean Roughness
Represents the average deviation of surface peaks and valleys from the mean line.
- Milling or turning: Ra ≈ 3.2 µm
- Fine grinding: Ra ≈ 0.8 µm
- Polishing: Ra ≤ 0.2 µm
Rz – Ten-Point Height
Indicates the average difference between the five highest peaks and five deepest valleys within a sampling length.
It is especially useful for assessing sealing and bearing surfaces.
RMS – Root Mean Square Roughness
Similar to Ra but gives greater weight to extreme peaks and valleys.
Common in aerospace and optical surface evaluation.
Lay and Waviness
Lay describes the primary pattern direction on the surface, while waviness represents larger, periodic deviations caused by machine or tool vibration.
Surface Finish Conversion Chart
Different regions and standards express surface finish differently.
The most widely used are ISO 1302 and ASME B46.1, which classify surfaces by Ra values and grade numbers.
| Ra (µm) | Rz (µm) | Typical Machining Process |
|---|---|---|
| 12.5 | 50 | Rough turning / milling |
| 6.3 | 25 | Semi-finishing |
| 3.2 | 12.5 | General finishing |
| 1.6 | 6.3 | Precision turning |
| 0.8 | 3.2 | Fine grinding |
| 0.4 | 1.6 | Super-finishing |
| 0.2 | 0.8 | Polishing |
| ISO Grade | Ra (µm) | Example Process |
|---|---|---|
| N1 | 0.025 | Optical mirror surface |
| N4 | 0.2 | Polished parts |
| N6 | 0.8 | Fine grinding |
| N8 | 3.2 | General machining |
| N10 | 12.5 | Rough turning |
| N12 | 50 | As-cast surface |
Ra and N-grade notations are interchangeable; for instance, Ra 1.6 µm ≈ N6.
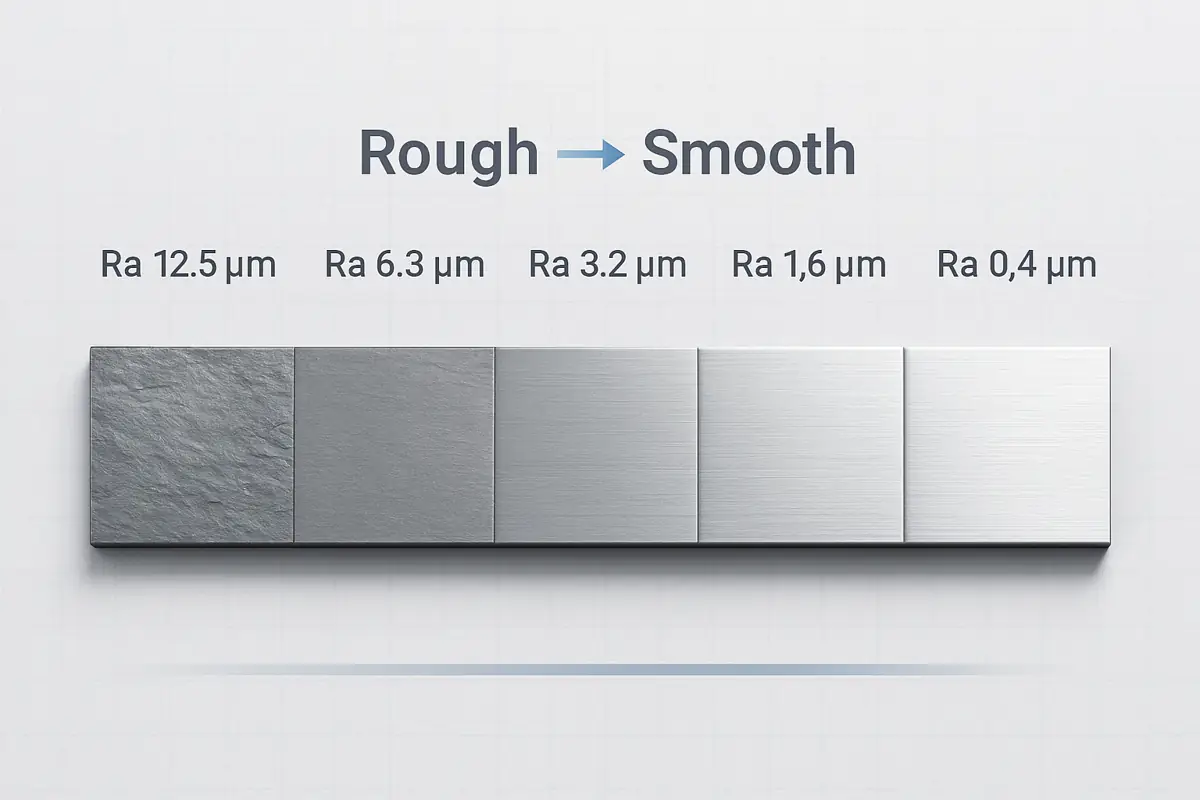
Visual Comparison of Surface Finish Levels
Numerical roughness values alone do not always convey visual or tactile differences.
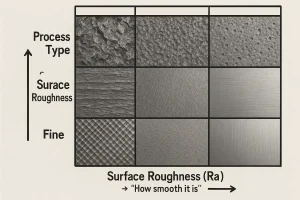
Visual chart comparing machining process types and corresponding surface roughness (Ra) levels from rough to fine finishes.
A visual comparison helps engineers and buyers quickly understand what each level represents.
| Finish Level | Ra (µm) | Visual Appearance | Typical Process |
|---|---|---|---|
| N12 – N10 | 50 – 12.5 | Visible tool marks, coarse texture | Rough turning |
| N9 – N8 | 6.3 – 3.2 | Uniform pattern, slightly rough feel | General machining |
| N7 – N6 | 1.6 – 0.8 | Smooth surface, few visible lines | Fine grinding |
| N5 – N4 | 0.4 – 0.2 | Bright and reflective | Polishing or honing |
| N3 – N1 | ≤ 0.1 | Mirror-like finish | Precision polishing |
Factors Affecting Surface Finish
The quality of a machined surface depends on many interacting variables.
- Tool geometry and wear
- Cutting speed and feed rate
- Workpiece material hardness
- Lubrication and cooling condition
- Machine vibration and fixture rigidity
For example, increasing the feed rate typically increases roughness, while insufficient coolant can cause built-up edges and tearing that damage finish quality.
Surface Finish vs Surface Roughness
Surface roughness is the measurable component of surface finish, quantifying small irregularities using parameters such as Ra and Rz.
Surface finish, however, is a broader term that includes roughness, waviness, and lay direction, describing the complete surface texture.
Two parts can share the same Ra value but differ in texture and function if their lay or waviness differ.
This distinction ensures that design drawings specify both quantitative parameters and texture characteristics.
Conclusion
Surface finish is a critical indicator of machining quality.
It determines how well a part fits, moves, seals, and endures under load.
By optimizing cutting parameters, tool geometry, and cooling strategies, manufacturers can achieve target finishes efficiently and economically.
Setting realistic finish requirements early in the design phase allows for better cost control and consistent performance.
Request a quote from our engineering team.
Upload your drawings for a fast engineering review and quote.